Reverse Discounted Cash Flow (DCF) Calculator: Step-by-Step Guide
Navigating the stock market is part art, part science. To master the science part, investors use valuation methods like the reverse DCF (Discounted Cash Flow) model. It helps you peel back the layers of stock prices to understand what kind of future cash flow growth investors are expecting. Our site has a free and very useful Reverse DCF Calculator, so here's your straightforward to using it, complete with an example to get you started.
What Is a Reverse DCF Valuation Calculator?
The reverse DCF calculator inverts the traditional approach of estimating a stock’s value. Instead of projecting future cash flows to determine a stock's worth, it uses the current stock price to reveal the growth expectations of investors. It's all about figuring out what growth investors are expecting right now based on how much they're willing to pay for a share. This perspective is crucial for making informed investment decisions.
How to Set Up the Reverse DCF Calculator
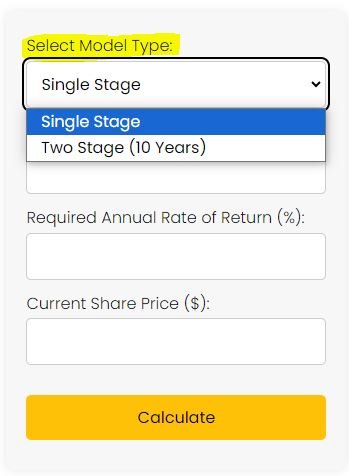
First things first, hop onto your reverse DCF calculator and get ready to pick a model. You’ve got two choices (single stage and two stage) from the drop down menu. See the screenshot below. Select the appropriate model based on the company's growth outlook:
Single Stage: This assumes that the company’s free cash flow will grow at a constant rate forever. Simple and sweet. It’s generally best suited for stable, more boring companies.
Two Stage (10 years): Here's where things get a bit more nuanced. This model assumes the company will enjoy a period of high growth for the first 10 years and then settle into a more stable growth phase indefinitely.
Inputs required:
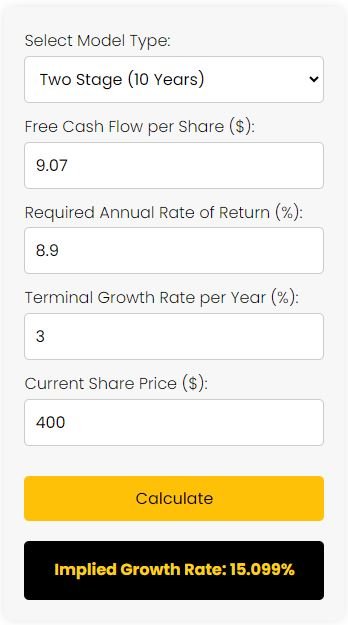
Free Cash Flow per Share ($): Input the FCF per share (alternatively, you can write the actual free cash flow number). For example, according to Finbox, Microsoft (NASDAQ:MSFT) has FCF per share of $9.07 for the last 12 months. On a nominal basis, its free cash flow is $67.445 billion, so you could input that number instead if you’d like.
Discount Rate (%): This is your required rate of return, essentially what you expect to earn on the investment. It can be determined based on historical market returns, adjusted for personal risk tolerance, or calculated using models like the CAPM (Capital Asset Pricing Model), which considers the risk-free rate plus a premium for market risk. Learn more about discount rates here.
Terminal Growth Rate (% per year) — This applies to the Two Stage only: The expected growth rate after the initial high-growth period. Basically, it’s the expected growth that the company will experience in perpetuity. Typically, the terminal growth rate is assumed to be about the long-term growth rate of the economy or the industry in which the company operates. Common practice often suggests using a rate close to or below the long-term GDP growth rate, which for many developed economies ranges from 2% to 3%.
Current Share Price ($): The current price of the stock, say $400 for MSFT stock.
After entering the data, hit 'Calculate' to see the implied growth rate.
A Real-Life Example on MSFT Stock
Now, let’s do a real-life reverse DCF valuation on MSFT stock using the two-stage model. So, let’s input the numbers:
Free cash flow per share: $9.07
Required rate of return (discount rate): 8.9% — This is Microsoft’s cost of equity, which we took from Finbox here.
Terminal growth rate: 3%
Current share price: $400
Computing the numbers below into our calculator, you can see that the market is pricing Microsoft to grow its free cash flow per share by 15.099% for the next 10 years and then 3% per year in perpetuity after that (the terminal growth rate).
What to Do With This Information
So, the calculator says Microsoft is priced for ~15.1% growth in FCF per year. What now? This is where your investor’s intuition kicks in. Ask yourself:
Does 15.1% seem low? Maybe the market’s missing something, and Microsoft is about to take off. If you've got reason to believe they’ll grow faster, the stock might be a bargain.
Does 15.1% seem high? If the industry's on a downswing, or if Microsoft has been struggling, that 15.1% might be too optimistic. If so, the stock could be overvalued.
Is 15.1% just right? If you think Microsoft will grow at 15.1% and you're happy with that return, then the price is fair.
How to Know Whether to Buy, Hold, or Sell
Your next move depends on how the implied growth rate stacks up against your own expectations and the risks you see.
Buy? If your research suggests the growth rate could be higher than what’s implied, you might have found yourself a winner. You can even look to analyst estimates on a site like simplywall.st or Seeking Alpha to help you decide.
Sell? If it looks like the calculator's rate is too rosy, and you own the stock, it might be time to think about letting go.
Hold? If the rate looks spot on, and you're already invested, stay the course. If you're not, dig a little deeper before you make a move.
The Takeaway
In the end, a reverse DCF calculator is about more than just numbers. It’s a reality check against the market’s mood swings, helping you make decisions that align with your investment strategy and expectations. Use it as a starting point, add your insight, and you’re on your way to investing with clarity.