Tesla, Visa: Are These Stocks Undervalued after Earnings?
Tesla (NASDAQ:TSLA) and Visa (NYSE:V) reported earnings after market close today. TSLA missed earnings, while Visa beat both revenue and EPS forecasts. Let’s briefly take a look at each company’s earnings report and then see if these stocks are undervalued using our Reverse DCF Calculator.
Tesla Earnings Analysis
EPS of $0.45 vs. $0.49 expected, down 47.1% YoY
Revenue of $21.3 billion vs. $22.2B expected, down 8.6% YoY
Q1 operating margin: 5.5% — last year’s margin was 11.4%
GAAP Gross Margin: 17.4% — last year’s margin was 19.3%
Operating cash flow down to $242 million from $2.513B last year
Free cash flow down to -$2.531B from +$441 million last year
As per Benzinga, Tesla stated that its profitability was hampered for several reasons. These include a reduced average selling price due to pricing and mix, higher operating expenses, and a decline in deliveries. But this was partially offset by a lower cost per vehicle and higher FSD revenue recognition.
Tesla also plans to launch new models ahead of schedule. “We have updated our future vehicle line-up to accelerate the launch of new models ahead of our previously communicated start of production in the second half of 2025,” said the company.
So, there are some negatives (earnings and revenue miss, along with lower margins and profits) and some positives (launching new models ahead of schedule), but how does Tesla’s valuation look now after reporting earnings?
Is Tesla Stock Undervalued?
Currently, TSLA stock trades at $160 after hours, up about 10%. Using TTM adjusted EPS (instead of FCF per share) of $2.72 and its cost of equity of 11.1% (taken from Finbox), along with a terminal growth rate of 3% per year, we can arrive at a market-implied growth rate for TSLA stock, which will help us determine if the stock is undervalued or not.
Essentially, at current prices, the market expects Tesla to grow its earnings by 24.35% per year for the next 10 years and then by 3% in perpetuity after that. If you believe Tesla can surpass this growth rate, then the stock is undervalued, and vice versa. See below.

Now, there’s one crucial thing to consider here. It’s called stock-based compensation (SBC) — when companies issue shares to employees as awards. This dilutes shareholders and is a real expense that often gets added back to “adjusted” EPS.
For instance, TSLA’s net income was $1.578 billion for the quarter, but its stock-based compensation (net of tax) was $407 million — almost 25%. So, in reality, using adjusted EPS for a valuation is a less conservative measure, and if you were to adjust for SBC, the valuation would look worse. In the past year, its adjusted net income was $9.526 billion, and its SBC net of tax was $1.801 billion.

Therefore, TTM earnings, when NOT adding back SBC, are $2.217 per share. Let’s re-evaluate Tesla with that in mind. Now, as you can see below, the implied growth rate rises to 27.255%.

Again, if you think TSLA can surpass this growth, it’s undervalued. This is the part where your forecasting and intuition come into play. You can also use analyst estimates to help you figure out where growth may be headed. Below, are the most recent estimates, which may actually be revised lower soon since Tesla missed earnings.

Tesla’s Cash-Flow Problem
As stated above, Tesla’s cash flow has fallen significantly. If you look at the TTM free cash flow figures below, you’ll see that its FCF is down to $1.386B. Throw in SBC expenses (which are over $1.9 billion when not net of tax), and it’s basically negative. Thus, if you used free cash flow for the DCF valuation above, Tesla would look very overvalued.

Visa Earnings Analysis
With Visa, things are more simple since it’s a more stable company. Here are its results:
EPS of $2.51 (up 20% year-over-year) beat estimates of $2.44.
Revenue of $8.775B (up 10% year-over-year) also beat the $8.62B estimate.
Visa’s Outlook
Interestingly, Visa expects low-double digit net revenue growth for the next 2 quarters, which is a great sign for such a mature company. It also expects “high end of low double-digit” growth for EPS in Q3 and low-teens EPS growth for the full year.

Is Visa Stock Undervalued?
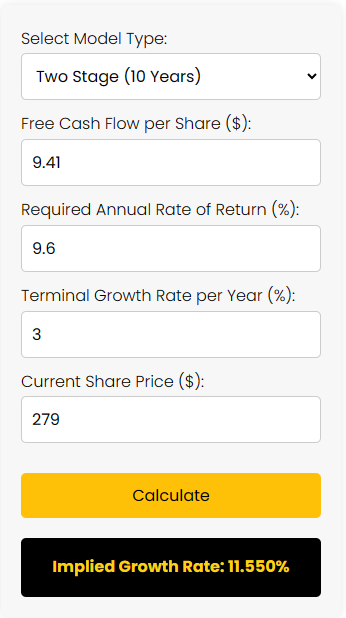
Let’s use our Reverse DCF Calculator tool again to determine whether V stock is undervalued. Spoiler: it looks reasonably priced.
Inputs used:
Used TTM EPS of $9.41 instead of FCF per share
Cost of equity: 9.6% (taken from Finbox). This was used as the discount rate
After-hours share price: $279
Overall, the market expects V to grow its EPS by 11.55% for the next 10 years and then by 3% every year after that.
Since Visa is a mature company, it’s easier to understand if this implied growth rate is reasonable or not. Considering that its EPS grew by 20% this quarter and grew at a CAGR of 13.4% from 2018 to 2023 and a CAGR of 18.8% in the past five years, it’s very reasonable to assume that V can achieve (or beat) a market-implied EPS growth rate of 11.55% over the next 10 years. Its 2024 guidance calls for growth in that area as well. Therefore, V stock looks good right now. Disclosure: we’re not long V, but we are long Mastercard stock (NYSE:MA).
One thing to note: we’re not adjusting for stock-based compensation for Visa because SBC is not nearly as big of an expense for Visa as it is for TSLA, so it won’t affect the calculation that much.
Here were Visa’s long-term estimates before earnings came out. These could potentially get revised higher, as V beat the most recent estimates.

The Takeaway
What to take away from this article: First, Tesla missed earnings, and its figures are trending in the wrong direction, but there are some positives. However, its valuation could be a bit optimistic, and growth is hard to forecast. It’s not our cup of tea. We think there are easier companies to buy out there. Plus, its cash flow metrics aren’t looking great right now.
Regarding Visa, we’re not long the stock, but we do see long-term upside potential, given its solid results, predictability, and reasonable valuation. The market is only expecting its earnings to grow by 11.55% for the next 10 years, which is definitely achievable.
You may also be interested in reading this: Reverse Discounted Cash Flow (DCF) Calculator: Step-by-Step Guide